Molecular Graphics
Info
The visualization of molecular structures and their interactions is of central importance in molecular modeling. The technologies for providing the 3D perception, the different ways to visualize small-molecules and proteins; also the representation of molecular surfaces and volumes will be presented.
Number of Pages: 76 (±1 hours read)
Last Modified: January 2004
Prerequisites: None
Introduction
Importance of Molecular Graphics
One of the most important things for the molecular modeler is to visualize molecular structures and interactions in order to calibrate his intuition and to develop a feeling of the structures concerned.

Almost Science Fiction
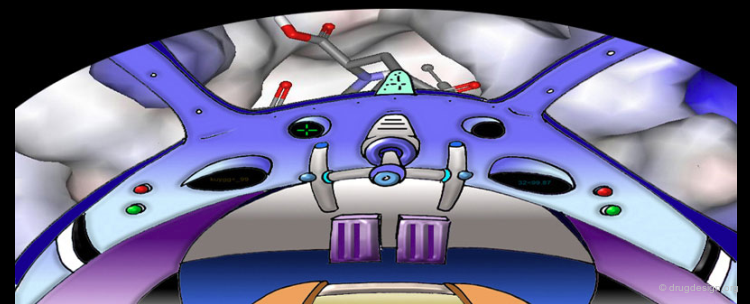
Computer graphics enables us to visualize complex machinery underlying highly coordinated biological processes. Geometrical measurements, shape analyses, design and evaluation of candidate prototypes are all operations that are used daily by the usual locksmith but these operations are more complicated in drug discovery. Today, research teams using very unusual visual apparatus work hours and hours with 3D graphical displays and can virtually "enter" into the precise 3D structure of a protein and construct atom by atom an inhibitor that can lead to a drug that will stop the development of a disease. One would think that the following scene is taken from a science fiction movie but today it is possible with computer graphics!
articles
Computer Graphic Tool for Colour Structure Display on Personal Computers Cozzini P, Pavesi P and Andreetti GD J. Mol. Graph. 3(3) 1985
History of Molecular Visualizations
1970-1975: In the beginning, no graphical software programs existed for 3D drug design. Computers existed but they were mainframe computers. Physical models (plastic or metallic) were very popular and allowed "hand" manipulation of the three-dimensional structures.

articles
New Skeletal-Space-Filling Models Clarke FH J. Chem. Educations 54 1977
Plastic Dreiding Models Fieser LF J. Chem. Educations 40 1963
Computer Representation of Molecular Surfaces Max NL J. Mol. Graph. 2(1) 1984
Generation of Molecular Surfaces for Graphic Display Pearl LH and Honegger A J. Mol. Graph. 1(1) 1983
1975-1978
1975-1978: The second period witnessed the development of molecular modeling software in drug design. The output of these programs were generated numerically or with graphical representations produced by graphical plotters.

1978-1980
1978-1980: One of the first commercially available graphical systems was "Tektronix" displays. They had poor resolution and no colors. They were so slow that it was not possible to envision that they could allow real-time rotations.

1980-1995
1980-1995: "Evans & Sutherland" graphics system revolutionized molecular modeling. They provided colored pictures of excellent quality and included real time rotation and stereo. However the cost of a single display was $150,000! Towards the end of that period, "Silicon Graphics" introduced less expensive yet high performance workstations that were within the budget of most academic and industrial laboratories (approximately $ 30,000).

1995-now
"1995-now": A large range of graphic workstations became available to meet the need of modeling applications ranging from simple, small molecules to complex macromolecules. Basic inexpensive systems like PC or Macintosh combined with efficient graphic software were available for less than $1.000 and provided visualization means that were accessible to all.
Commercially Available Molecular Kits
Hand-held commercial models have the advantage of being concrete objects that can be manipulated and provide a physical "feeling" of their actual geometrical features. It is not possible to construct on a routine basis proteins, neither is it easy to introduce a molecule in its active site or to superimpose together two or three proteins or two or three small molecules. Molecular graphic software programs offer great flexibility and include the visualization of color-coded properties that are associated to the different structural fragments.
articles
Colour Molecular Graphics on a Microcomputer Hubbard RE J. Mol. Graph. 1(1) 1983
Progress in Graphical Hardware and Algorithms
The simultaneous development of advanced graphic hardware and graphic algorithms for efficient visualization revolutionized the 3D displays.
articles
Colour Molecular Graphics on a Microcomputer Hubbard RE J. Mol. Graph. 1(1) 1983
Algorithm 1
First steps in computer graphics were very disappointing. The following represents an attempt made in 1967 to represent the surface of a molecule with relatively advanced graphic displays based on successive sections of its volume.

Algorithm 2
The following shows the quality of the pictures that can be generated with efficient graphical algorithms (open GL). The algorithms were developed to achieve optimal efficiency in terms of both quality and speed.
Molecular Graphics Functions
A molecular graphics system should provide the following three basic functions. Editing: Some type of "construction kit" must be available so that molecules can be built and modified. Visualization: Each molecule should be visualized in three-dimensions, color-coded and labeled. Manipulation: It must be possible to move and rotate molecules independently in any direction and about any axis and to manipulate their torsion angles.

articles
A molecular Editor Program Hilmer RM J. Mol. Graph. 7 1989
3D Perception
The Perception of the Third Dimension
Although defined in 3D, the molecular representations are visualized on a 2D computer screen. In drug design, good perception of the three-dimensional nature of the molecule is essential and many techniques of graphic software provide a three-dimensional illusion.

From 3D Coordinates to Screen Coordinates
The representation of a molecule (3D object) on a graphic display actually consists of calculating a series of projections of the 3D object onto the 2D plane of the screen.
2D Projection is Not Sufficient
The 2D projection is not sufficient. You have to rotate the object to perceive its 3D features. The following represents the crystal unit of Zirconium. Notice the difference when you rotate it!

Real Time Manipulation
A real-time manipulation of the molecular structure representation, can provide a convincing three-dimensional illusion of the molecules.

Depth Cueing
Depth cueing is a technique in which distant objects are drawn progressively darker. This creates the perception of depth in the representation.

articles
Depth-Buffer Algorithms for Molecular Modelling Connolly ML J. Mol. Graph. 3(1) 1985
Perspective
Perspective is a technique in which distant objects are drawn progressively smaller.

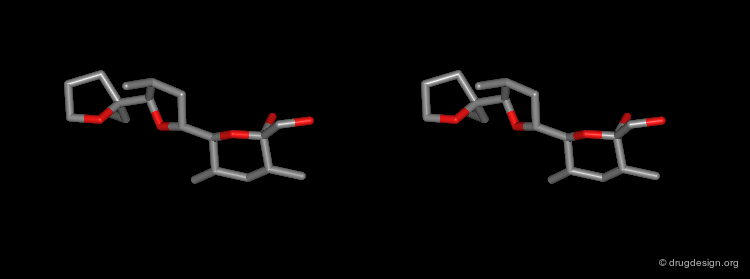
Stereo
Whereas real-time manipulations provide a 3D feeling, stereo is critical to maintain that three-dimensional perception. Stereo perception involves presenting a left and right eye view of the molecule to the appropriate eye of the user. In this case, dividing the screen into two halves provides stereo and the left and right views are represented and are ready to be mentally superimposed by the user.
articles
Stereo Viewing on the PC/AT with EGA Graphics Chelvanayagam G and McKeaig L J. Mol. Graph. 9 1991
Display of Red/Green Stereo Images Using a Raster Colour Image Display Jackson PH J. Mol. Graph. 1(1) 1983
Hardware Stereo
Hardware stereo is a trick incorporated in graphics systems. The monitor runs at double the frequency so that the screen presents alternate eye views one after another. The user wears a pair of goggles containing liquid crystal shutters and an infrared emitter on the workstation synchronizes the visibility of the screen to each eye. These capabilities are sometimes incorporated in the hardware and software equipment of a workstation and are available to support effective hardware stereo.

articles
Stereo Viewing on the PC/AT with EGA Graphics Chelvanayagam G and McKeaig L J. Mol. Graph. 9 1991
Visualization
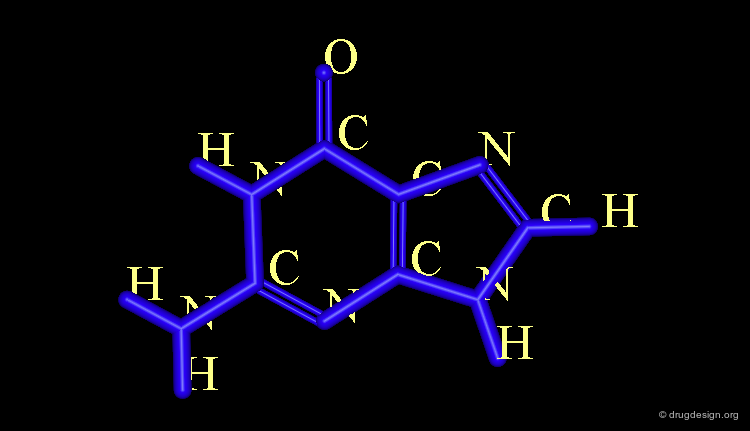
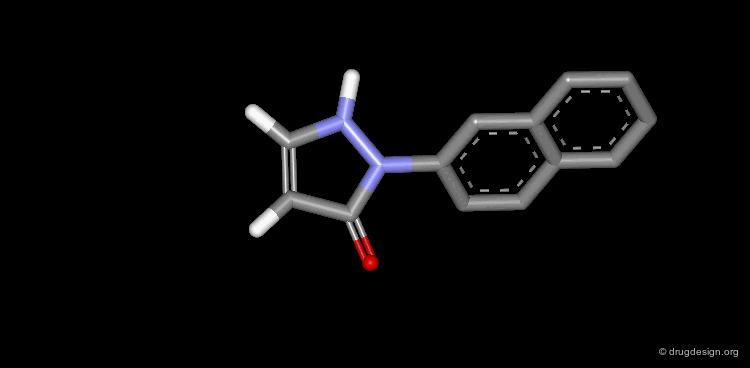
3D Representation of Small Molecules
Molecules can be displayed with different rendering techniques including Line, Stick, Ball and Stick, CPK etc...

Line
This is the simplest and most common way to visualize molecules where the bonding arrangement is represented in 3D. This type of representation is also called "wireframe".

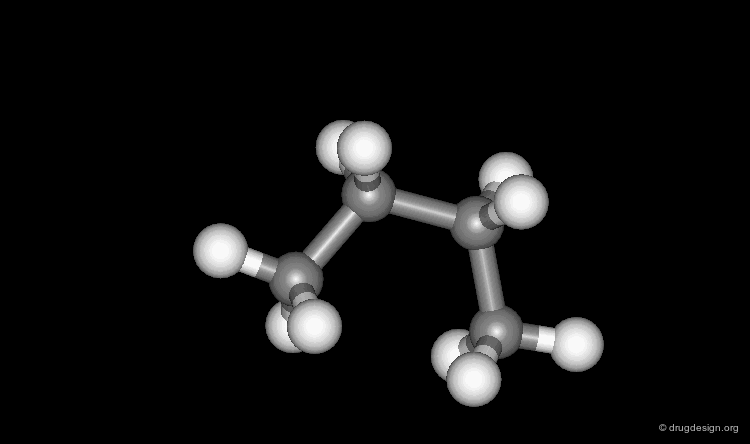
Stick
In this type of representation the bonds are represented as tubes. It is also called "polytube".

Ball & Stick
Here the molecule is displayed as the assembly of atoms and bonds. Atoms are represented as small spheres and bonds as tubes.

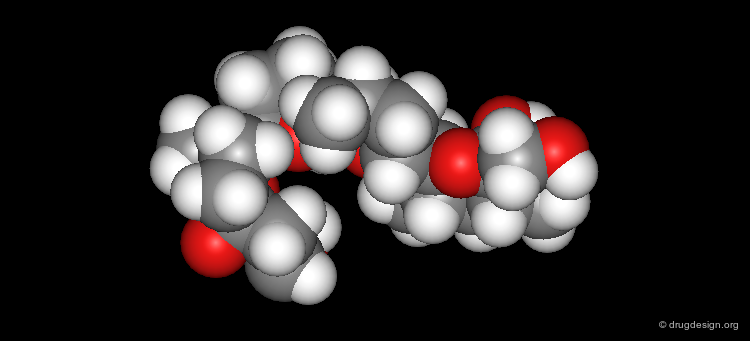
CPK
In this type of representation the molecule is defined as a set of spheres of van der Walls radii of the individual atoms.

Quality of Rendering
Although considered as a sphere, in molecular graphics visualizations, an atom is treated as a polyhedron. A view calculated with a small number of faces is of poor quality; however by increasing the number of faces the quality increases.


articles
Rendering Volumetric Data in Molecular Systems Goodsell DS, Mian IS and Olson AJ J. Mol. Graph. 7 1989
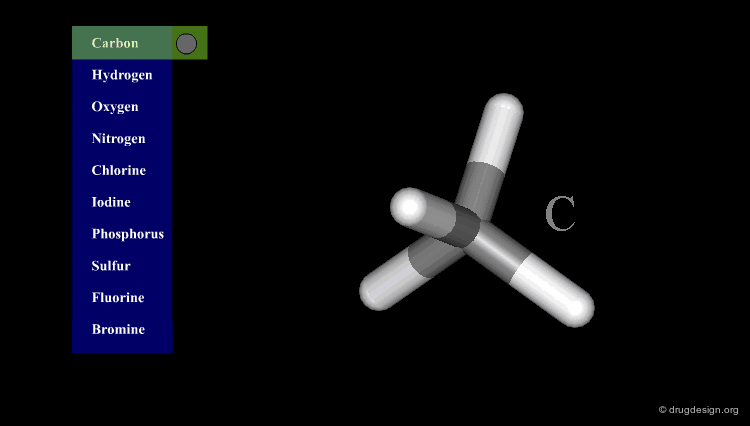
Atomic Color-Code Convention
A color is associated with each type of atom. The following color-code convention is generally accepted and implemented in most popular molecular graphic systems.
Coloring Molecules or Sets of Atoms
Molecules can be colored in different ways: by atom-type, by molecule, by color, by properties etc...
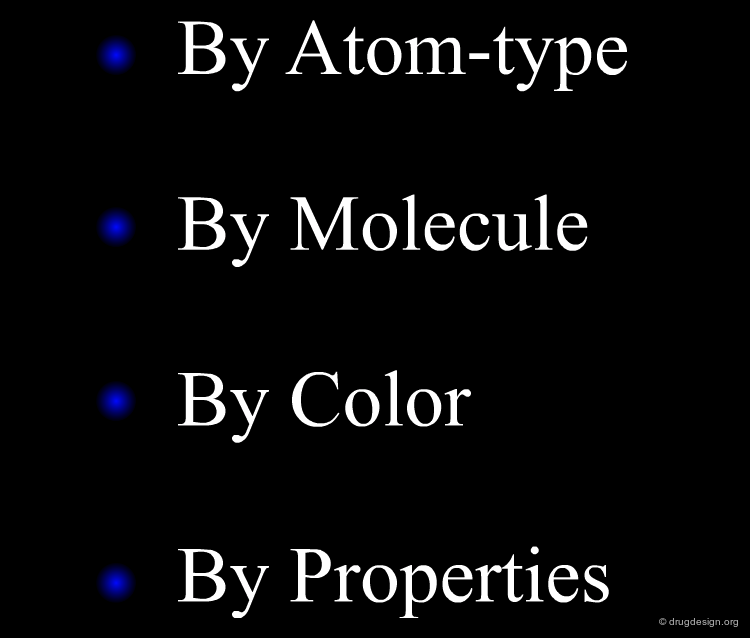
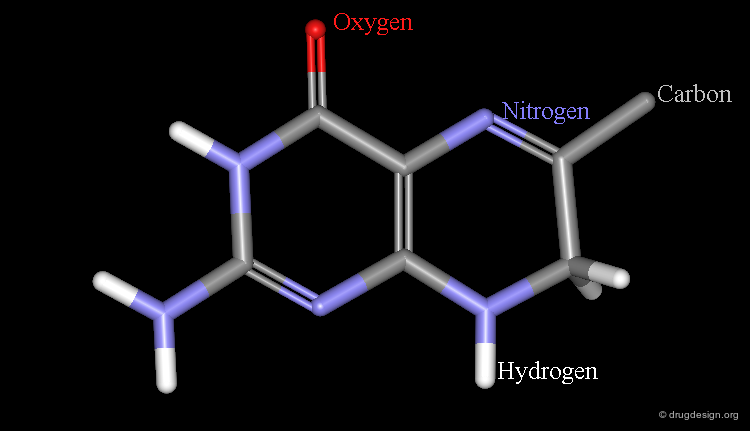
By Atom-type
In this representation the atoms are colored according to the atomic color-code defined and a color is also given to half of the bonds of this atom.
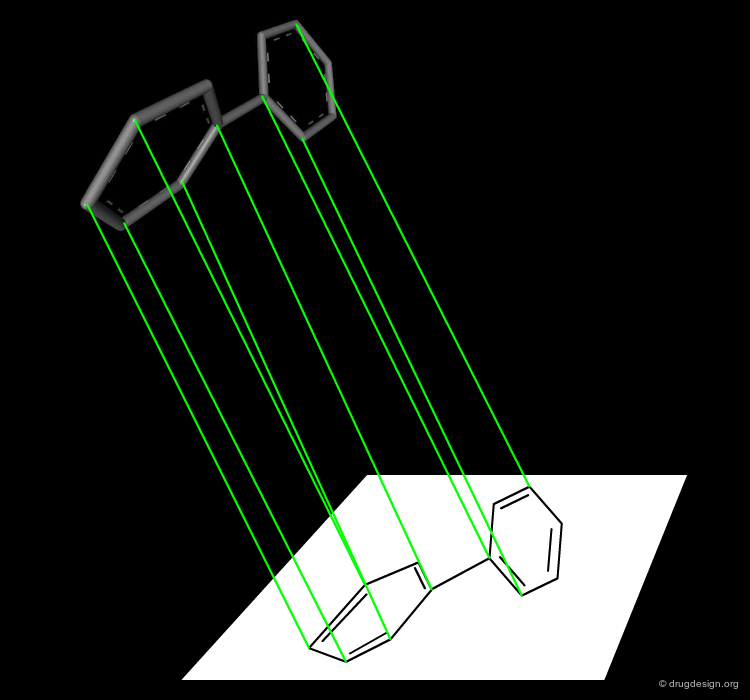
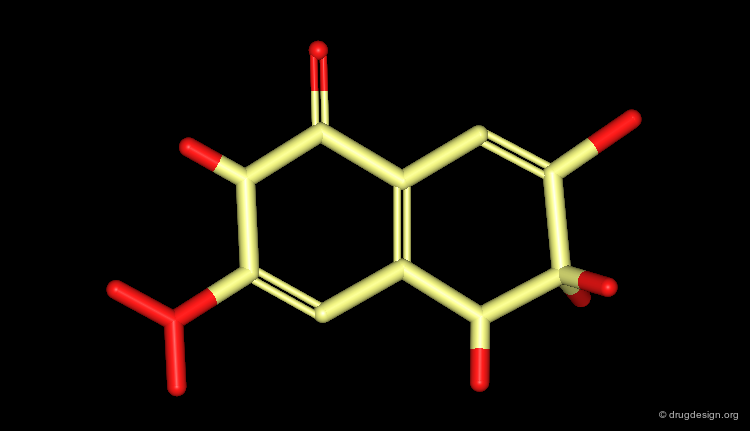
By Molecule
A different color is given to each of the molecules visualized in the screen. It is useful when several molecules are superimposed to distinguish and recognize the individual molecules in the view.

By Color
All or part of a given molecule is visualized in one color. Interactive "picking" of the molecule or a set of atoms allows one to associate a color with a specified set.
By Properties
Various molecular properties can be visualized. The quantitative or qualitative variations can be color-coded defined and visualized for every element considered: atom, bond or the molecular surface.

Labeling Functionalities
Various labels can be added: those which are associated with the molecules and those associated with the screen. The first ones move with the molecules (green) and the other ones are fixed (white).

Atom Labels
If an entire molecule is represented in one color, it is not possible to recognize the different types of atoms. It is useful to label specific atoms in order to facilitate further analyses (e.g. hydrogen bonding capabilities or atomic mimicry).
Atom Numbering
This type of representation is useful when associated with computerized numerical treatments or to follow the 3D view associated with a publication in which some details are given and atoms are described by their number (Nitrogen 24, or hydroxyl of Ser-76).

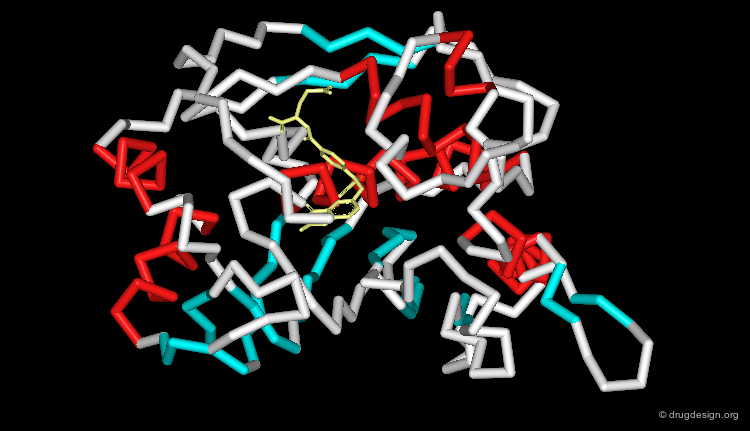
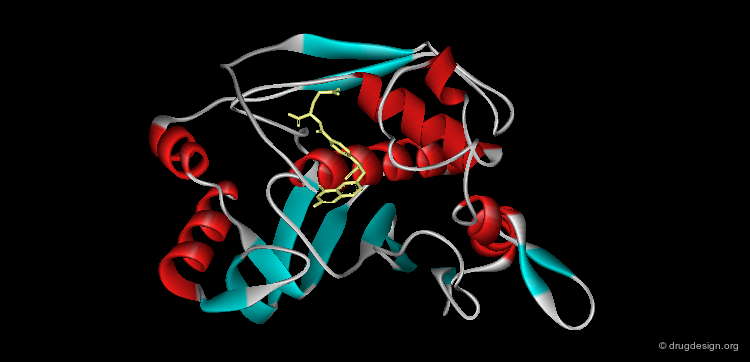
Proteins Representation
Macromolecules are complex entities. They can be displayed as small molecules using various techniques (ball and stick, space-filling, etc.). Other representations are specific to macromolecules and give an overview of the overall molecular architecture of the protein.

articles
Interactive Program for Visualization and Modelling of Proteins, Nucleic Acids and Small Molecules Dayringer HE, Tramontano A, Sprang SR and Fletterick RJ J. Mol. Graph. 4(2) 1986
Carbon Alpha
This representation is also called "carbon-α trace". It is useful for editing and aligning different proteins.
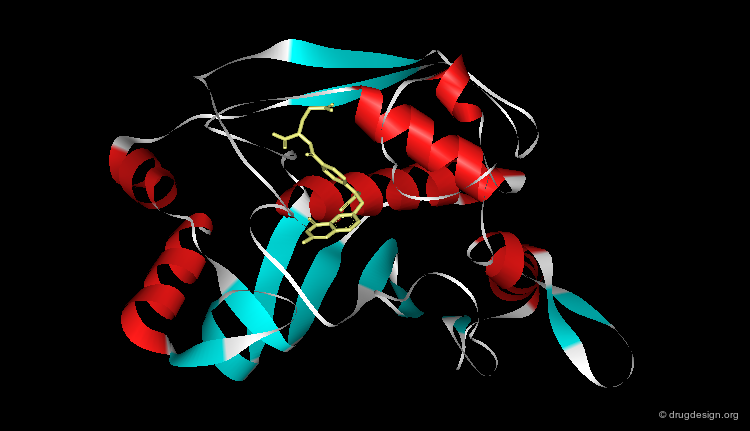
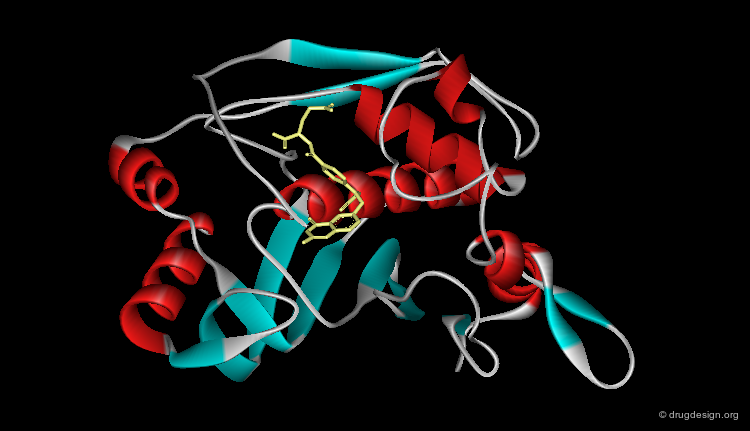
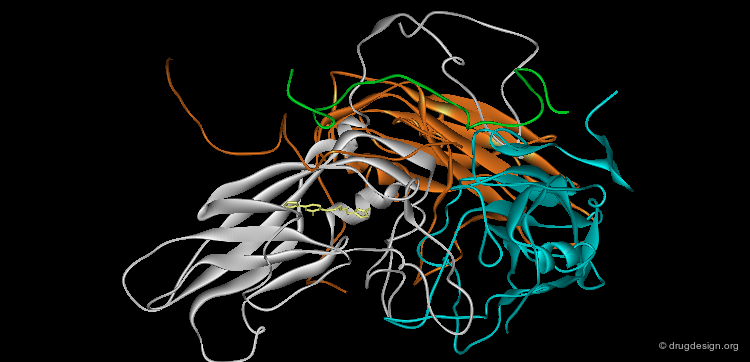
Ribbon Representation
Ribbon representations are specific to proteins and provide an overview of the overall molecular architecture (secondary structure) of the protein. α-helices, β-sheets and β-turns are easily recognized.

articles
Interactive Program for Visualization and Modelling of Proteins, Nucleic Acids and Small Molecules Dayringer HE, Tramontano A, Sprang SR and Fletterick RJ J. Mol. Graph. 4(2) 1986
Ribbon Types
Here are different types of ribbon displays.


Visualization of Protein Properties
The macromolecular structure can be color-coded according to various physico-chemical properties such as residue types, electrostatic or hydrophobicity. The representation of color-coded surfaces of molecular systems has revolutionized molecular design analyses.


articles
Hydrophilicity of Proteins and DNA Walkinshaw MD and Floersheim P J. Mol. Struct. 237 1990
book
Gillilan RE and Ripoll DR Data Visualization in Molecular Science: Tools for Insight and Innovation Addison-Wesley Publishing Company Inc., Reading, Mass 1995
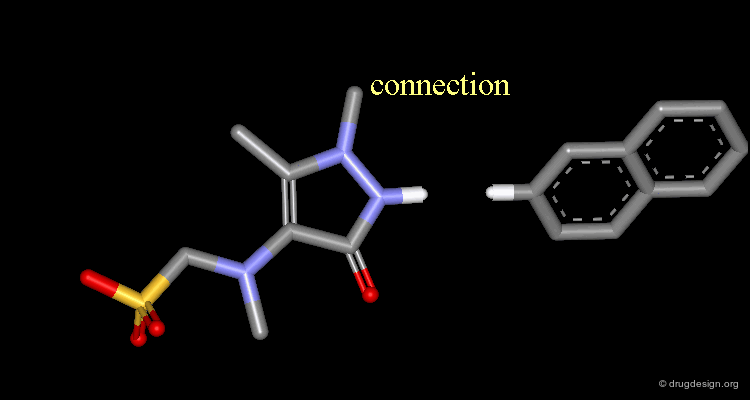
Editing & Manipulation
Structure Manipulation & Editing
In molecular modeling, the computer software provides tools that interact with the molecules visualized onto the screen. The most basic structure manipulations are: translation of all molecules, translation of one molecule relative to another, rotation of all molecules, rotation of one molecule relative to another, rotation of flexible bonds in a molecule, and molecular editing. These operations also are useful for the superimposition of molecules or for the insertion of a small molecule into the cavity of a macromolecule.

Add Atoms Function
3D Molecular Editing Functions - Add atoms
Delete Atoms Function
3D Molecular Editing Functions - Delete atoms

Fuse Atoms Function
3D Molecular Editing Functions - Fuse atoms

Connect atoms Function
3D Molecular Editing Functions - Connect atoms
3D Molecular Constructions
A simple method for adding new atoms in a molecule is to add hydrogen atoms on a given atom and then exchange the hydrogen with another atom (e.g. C, N, O)

Real-Time Rotations, Translations and Zoom
Current graphic displays offer real-time rotation and translation capabilities. Dials, joysticks and a mouse allow one to interactively manipulate items on the screen with a great deal of rotational and translational freedom.

Translations
Translation Example: click on the molecule and drag the mouse.

Rotations
Rotation example: click on the molecule and drag the mouse.

Zoom
Zoom functionalities are important for the visualization. They allow global and local analyses to be made in a flexible fashion. Zoom example: click on the molecule and drag the mouse.
Control of Torsion Angles
Molecules have rotatable bonds defining many conformations. Dials, joysticks and a mouse allow to interactively rotate bonds with a single hand.
Slab and Clip
Some molecular softwares incorporate "slab" functionalities. The aim of this operation is to visualize sections of the molecular volume. A projection plane can be moved and everything which is either above (top slab) or below (bottom slab) are removed. This allows one to better analyze for example the detailed volume of a macromolecular cavity or a free protein or with a bound ligand.

Surfaces & Volumes
Concept and Definition of Molecular Surfaces
The surface of a molecule represents an important structural feature that allows to understand the properties of the compound. Various definitions of the molecular surface have been proposed.

articles
Analytical Molecular Surface Calculation Connolly ML Journal of Applied Crystallography 16 1983
Solvent-Accessible Surfaces of Proteins and Nucleic Acids Connolly ML Science 221 1983
Computation of Molecular Volume Connolly ML J. Am. Chem. Soc. 107 1985
Molecular Surface Triangulation Connolly ML J. Appl. Crystallogr. 18 1985
Measurement of Protein Surface Shape by Solid Angles Connolly ML J. Mol. Graphics 4 1986
Computer Molecular Modeling and Graphic Design Dubois JE, Doucet JP and Yue SY Molecules in Physics, Chemistry, and Biology 1 1988
Approximation and Characterization of Molecular Surfaces Duncan B and Olson AJ Biopolymers 33 1993
Accessible Surface Areas as a Measure of the Thermodynamic Parameters of Hydration of Peptides Ooi T, Oobatake M, Nemethy G and Scheraga HA Proc. Natl. Acad. Sci. U.S.A. 84 1987
GEPOL: An Improved Description of Molecular Surfaces. I. Building the Spherical Surface Set Pascual-Ahuir JL and Silla E J. Comp. Chem. 11(9) 1990
GEPOL: An Improved Description of Molecular Surface III. A New Algorithm for Computation of the Solvent-Excluding Surface Pascusl-Ahuir JL, Silla E and Tunon I J. Comput. Chem. 15 1994
On The Analytical Calculation of Van Der Waals Surfaces and Volumes: Some Numerical Aspects Petitjean M Journal of Computational Chemistry 15 1994
Display of Quantum Mechanical Properties on Van der Waals Surfaces Quarendon P, Naylor CB and Richards WG J. Mol. Graphics 2(1) 1984
Molecular Volumes and Surfaces of Biomacromolecules Via GEPOL: A Fast and Efficient Algorithm Silla E, Villar F, Nilsson O, Pascual-Ahuir JL and Tapia O J. Mol. Graph. 8 1990
Analytical Molecular Surface Calculation Connolly ML Journal of Applied Crystallography 16 1983
Approximation and Characterization of Molecular Surfaces Duncan B and Olson AJ Biopolymers 33 1993
GEPOL: An Improved Description of Molecular Surfaces. I. Building the Spherical Surface Set Pascual-Ahuir JL and Silla E J. Comp. Chem. 11(9) 1990
GEPOL: An Improved Description of Molecular Surface III. A New Algorithm for Computation of the Solvent-Excluding Surface Pascusl-Ahuir JL, Silla E and Tunon I J. Comput. Chem. 15 1994
On The Analytical Calculation of Van Der Waals Surfaces and Volumes: Some Numerical Aspects Petitjean M Journal of Computational Chemistry 15 1994
Display of Quantum Mechanical Properties on Van der Waals Surfaces Quarendon P, Naylor CB and Richards WG J. Mol. Graphics 2(1) 1984
Molecular Volumes and Surfaces of Biomacromolecules Via GEPOL: A Fast and Efficient Algorithm Silla E, Villar F, Nilsson O, Pascual-Ahuir JL and Tapia O J. Mol. Graph. 8 1990
GEPOL: An Improved Description of Molecular Surfaces. II. Computing the Molecular Aarea and Volume Silla E, Tu{ntilde}{oacute}n I and Pascual-Ahuir JL J. Comp. Chem. 12(9) 1991
Van der Waals
The van der Waals surface: it corresponds to the molecular envelope containing atomic spheres of van der Waals radii.


Solvent
The solvent accessible surface: it corresponds to the molecular envelope of the surface of each atom which is accessible to the center of a probe sphere of a given radius, generally 1.4 Å (sphere including a water molecule).


Connolly
The Connolly surface is somewhat similar to the van der Waals, however it is mathematically defined in order to make it smoother. The Connolly surface is defined as the contact surface and the inward facing part of a probe sphere when it is simultaneously in contact with more than one atom.

articles
Solvent-Accessible Surfaces of Proteins and Nucleic Acids Connolly ML Science 221 1983
Computation of Molecular Volume Connolly ML J. Am. Chem. Soc. 107 1985
Molecular Surface Triangulation Connolly ML J. Appl. Crystallogr. 18 1985
Measurement of Protein Surface Shape by Solid Angles Connolly ML J. Mol. Graphics 4 1986
Surface Types
The most popular ways to render molecular surfaces are the following:

articles
SURFNET: A program for Visualizing Molecular Surfaces, Cavities and Intermolecular Interactions Laskowski RA J. Mol. Graph. 13 1995
Molecular Surface Representations by Sparse Critical Points Lin SL, Nussinov R, Fischer D and Wolfson HJ Proteins: Structure, Function, and Genetics 18 1994
A Fast Algorithm for Generating Smooth Molecular Dot Surface Rrepresentations Moon JB and Howe WJ J. Mol. Graphics 7 1989
Shaded Space-Filling Stereoscopic Representations Of Molecules As Dotted Surfaces Senn P Computers & Chemistry 20 1996
Normal
The soft surface is displayed here and represents the envelope of the molecules concerned.
Transparent
This is the same previous surface but with full transparency, which is essential for analyzing the detailed structural elements.
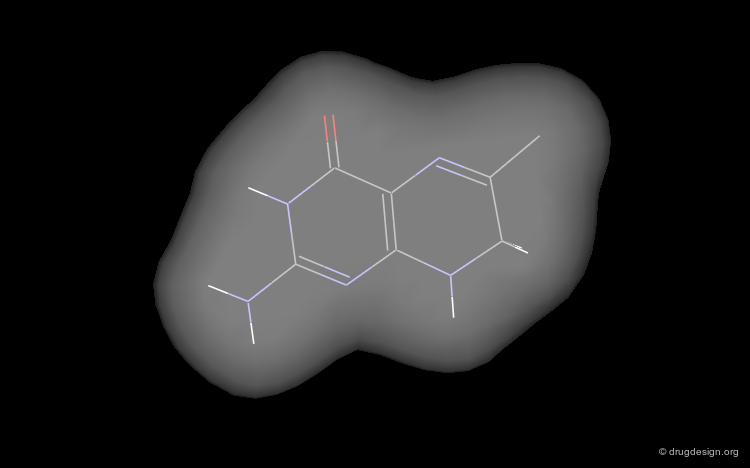
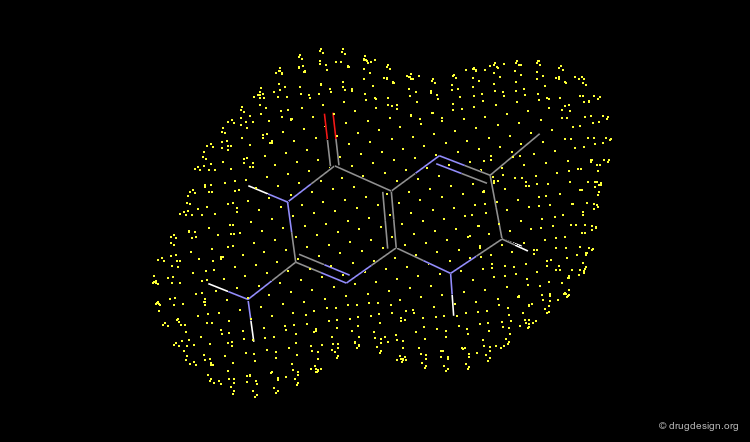
Dots
The surface is displayed as a set of dots regularly distributed on the surface. This kind of display is very convenient. It doesn't interfere with the displayed atoms and bonds of the chemical system and allows one to clearly see all the details of the molecules.
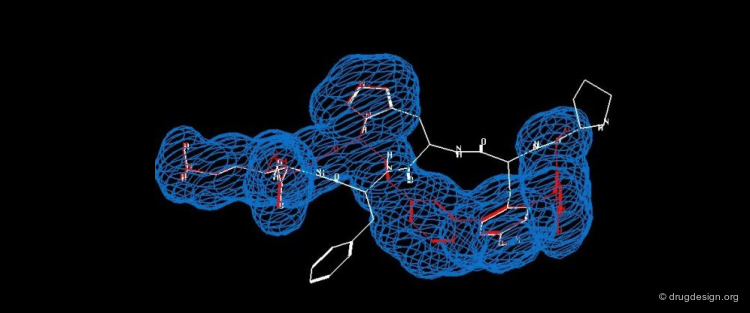
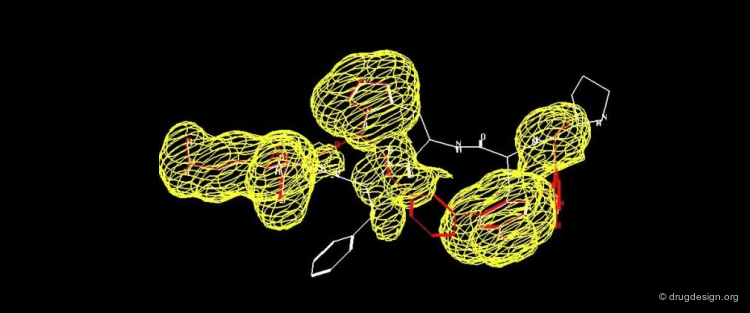
Visualization of Properties on Molecular Surfaces
Molecules are not inert entities. They have subtle physico-chemical properties (atomic charges, electrostatic potentials, hydrophobicity, polarizability) that strongly influence the way in which molecules interact with one another. The display of molecular surfaces that incorporates the added dimension of molecular properties will allow one to understand and predict how molecules interact with one another and dock with one another as well. It also aids in designing new molecules that will optimally bind to a target receptor. The corresponding surfaces can be displayed using color codes and contour lines.

articles
Le Potentiel De Lipophilie Moleculaire: Application A Une Serie d'Amines Beta-Adrenolytiques Audry E, Dubost JP, Dallet P, Langlois MH and Colleter JC Eur. J. Med. Chem. 24 1989
Molecular Modeling of the Ampiphipatic Helices of the Plasma Apolipoproteins Brasseur R, Lins L, Vanloo B, Ruysschaert JM and Rosseneu M Proteins: Structure, Function and Genetics 13 1992
Plotting Protein Surfaces Connolly ML J. Mol. Graphics 4 1986
The Molecular Surface Package Connolly ML J. Mol. Graphics 11 1993
Estimating and Representing Hydrophobicity Potential Fauchere JL, Quarendon P and Kaetterer L J. Mol. Graphics 6 1988
Visualizing Properties Of Atomic And Molecular Systems Flurchick K and Bartolotti L Journal of Molecular Graphics 13 1995
3-D Molecular Lipophilicity Potential Profiles, A new Tool in Molecular Modeling Furet P, Sele A, Cohen NC Journal of Molecular Graphics 6 1988
Electrostatic Potential Molecular Surfaces Weiner PK, Langridge R, Blaney JM, Schaefer R and Kollman PA Proc. Natl. Acad. Sci. USA. 79 1982
Color Coded
In color-coding procedures, each point of the molecular surface is color coded by the value of a given property. The following view displays the distribution of the electrostatic potential on the molecular surface.

Visualization of Properties on Molecular Surfaces
Contour lines are usually drawn in a plane like in geography. In the case of molecules, the contour lines are drawn on the 3D envelope of the molecule. The line connects points with the same value of the property (e.g. electrostatic potential) and a number is associated to the curve indicating the actual value of this property (e.g. energy). Contours with positive values are drawn in red while contours with negative values are drawn in blue.

book
N.C. Cohen ACS-CSJ Symposium on Computer Assisted Drug Design American Chemical Society, Washington,DC; ACS Symposium Series Vol.112 1979
N.C. Cohen Advances in Drug Research; volume 14 Academic Press 1985
The Visualization of Volumes
The volume occupied by a molecule is an important molecular determinant: it can be visualized, manipulated and also calculated.

articles
Shape Distributions of Protein Topography Connolly ML Biopolymers 32(9) 1992
Mathematical Boolean Operations with Volumes
Mathematical operations (e.g. logical Boolean treatments such as AND, NOT, OR) are useful. These kind of operations are essential for some drug design techniques, such as the Active Analog Approach. Operations such as addition or subtraction of volumes are also useful in measuring for example the quality of a superimposition or the amount of space that is occupied by a ligand in a receptor site. The following example displays the volume common to two molecules.

articles
Molecular Surface Comparison: Application to Drug Design Blaney F, Finn P, Phippen R and Wyatt M J. Mol. Graph. 11 1993
Visualizing Interactions
Visualization of Hydrogen Bonds
Molecules have rotatable bonds defining many conformations. Dials, joysticks and the mouse allow one to interactively rotate bonds with a single hand in order to maximize inter and intra molecular hydrogen bond interactions.

Visualization of Molecular Bumps
Unfavorable steric interactions (bumps) occurring between two molecules or between different structural entities of the same molecule can be displayed with molecular graphics in a simple way.

Surface Representations for Bump Analyses
Surface representations are very useful for identifying bumps in the modeling of a ligand interacting with its target protein.
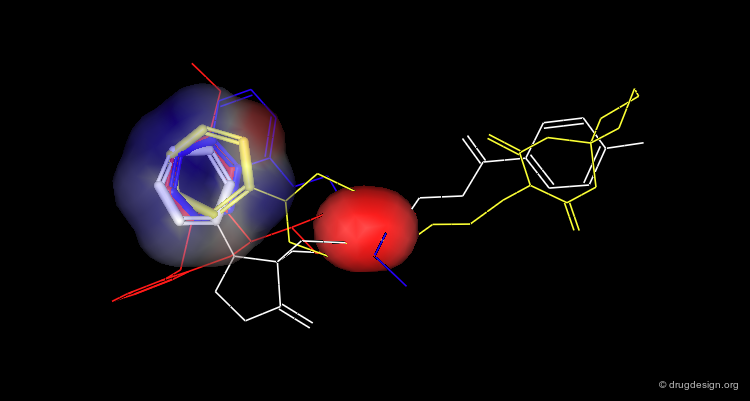
Complementary Surface Properties
It is possible to visualize the complementary features of a given property (e.g. lipophilicity, electrostatic potential etc.) of a ligand when it binds to its receptor. This can be done by displaying the property concerned onto the surface of the molecule when it is outside and inside the active site of the receptor.

articles
Le Potentiel De Lipophilie Moleculaire: Application A Une Serie d'Amines Beta-Adrenolytiques Audry E, Dubost JP, Dallet P, Langlois MH and Colleter JC Eur. J. Med. Chem. 24 1989
Electrostatic Potentials
Electrostatic potentials: a surface can be color-coded by electrostatic potentials and for example displayed in two colors (red & blue) when the surface is either positive or negative. A good affinity between the ligand and the receptor occurs when positive regions (red) interact with negative ones (blue).

Lipophilicity Potentials
Lipophilicity potentials: favorable complementary features of lipophilicity potentials are achieved in interactions of the same type, namely hydrophobic-hydrophobic and lipophilic-lipophilic interactions.

Visualization of Intramolecular Interaction
Current workstations with their fast processors can do "bump-checking" (checking for steric contacts closer than van der Waals) to visualize hydrophobic interactions and hydrogen bonds.

Schematic Complex Interaction
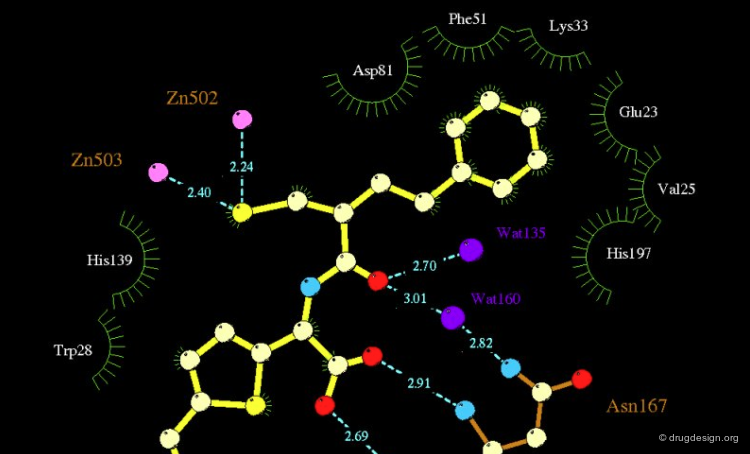
Schematic illustrations are useful in representing the interactions observed (or calculated) in a molecular complex. The following view represents a drawing generated automatically by the graphical program Ligplot and shows the detailed interactions of a small molecule and a protein.
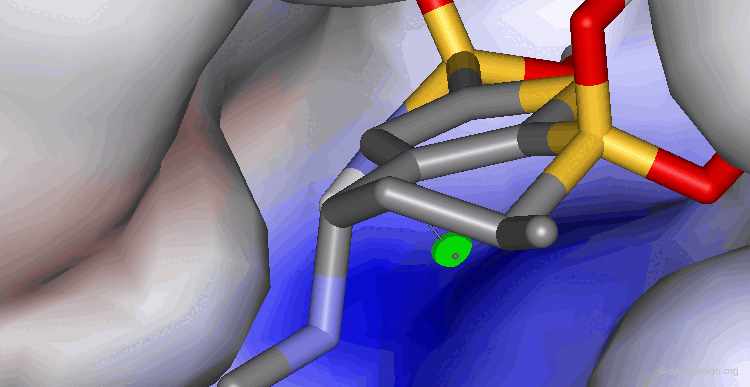
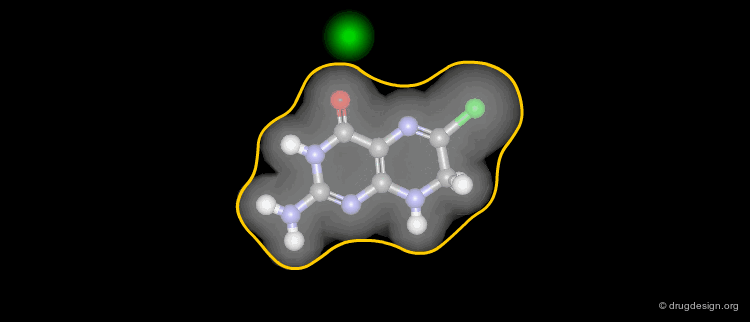
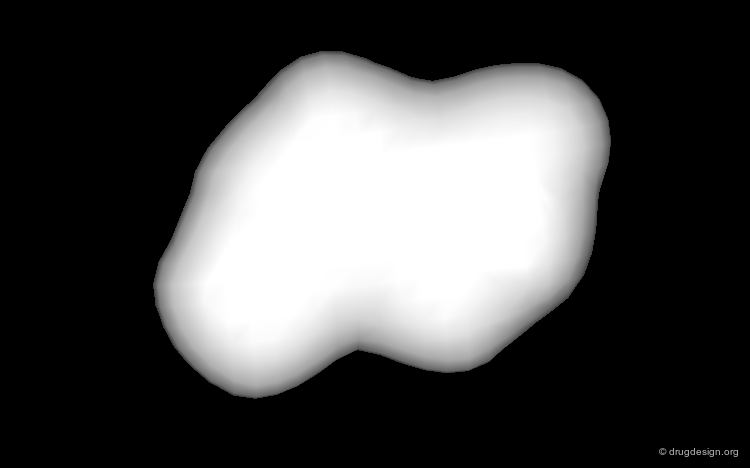
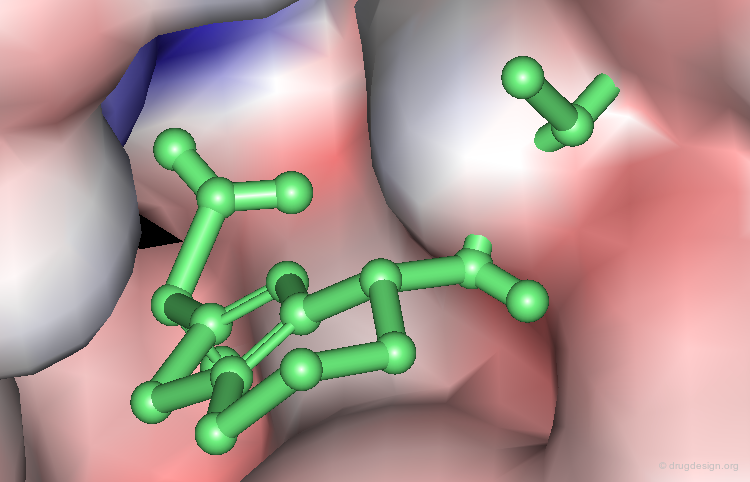
Visualization of a Complex Cavity
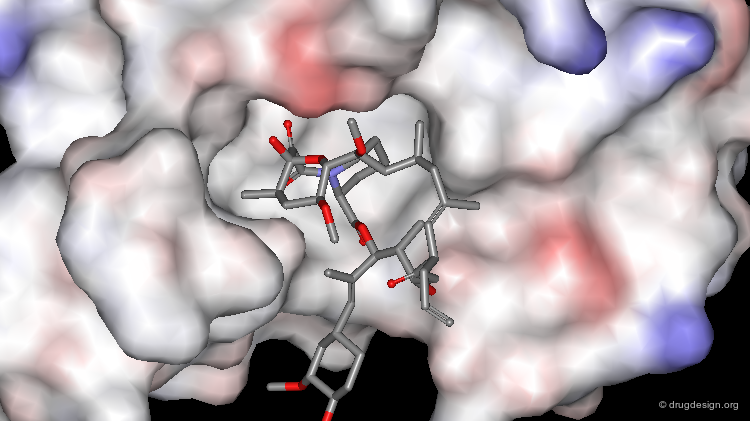
The following two views show the volume occupied by a ligand when it interacts with its target macromolecule. The view below focuses on the situation around the ligand (purple is volume of ligand and green is volume of target cavity).

Overview of the Entire Complex
While this view provides an overview of what the entire complex looks like.

Results of Quantum Mechanical Calculations
Quantum mechanical calculations provide a way to measure many properties of the molecule including electronic densities, localized orbitals, molecular orbitals (in particular the LUMO and HOMO orbitals). They provide detailed insight into the electronic nature of the molecular structures. Instead of treating them numerically, it is recommended to use computer graphics to visualize this information and take advantage of the graphical capabilities to facilitate their analysis.

Copyright © 2024 drugdesign.org